

Chainlink (LINK) could suffer further declines as key indicators point to possible corrections on the horizon.
After a period of relative stability, daily active addresses on the Chainlink network began to decline, indicating a possible reduction in market interest. Furthermore, the Average Directional Index, upon reaching 30, signals a strong and potentially sustained trend for the coming week.
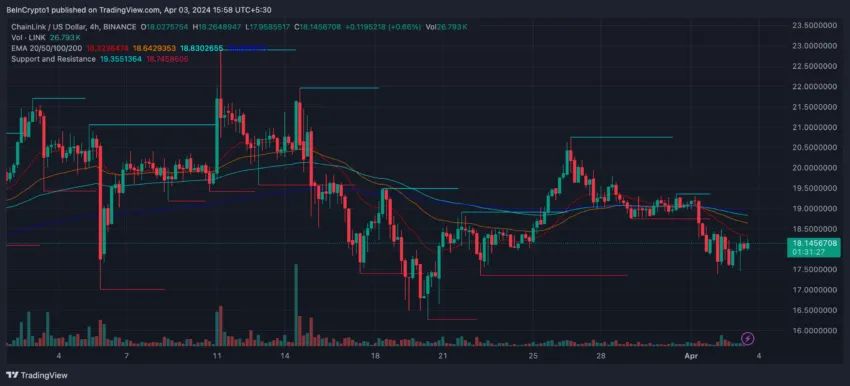
Concerns are further amplified by the formation of a bearish crossover at the exponential moving averages (EMAs) lines on April 1, suggesting an imminent downtrend that could lead to further price corrections.
Decrease in Chainlink network activity
Analysis of Chainlink daily active addresses provides essential insights into market dynamics. Initially, during the first three weeks of March, daily active addresses remained stable, fluctuating between 4,700 and 4,900.
However, a shift began on March 20, with a notable decline from March 21 to March 25, when daily active addresses dropped from 4,407 to 3,826.
Sponsored
After a short period of stability from March 25th to 30th, the beginning of April saw another drop, with daily active addresses falling from 3,856 to 3,627. This continued decline could signal declining interest in Chainlink, which could lead to adverse effects on its price.
The market could interpret reduced engagement and activity as decreased confidence in the asset’s value, possibly leading to a drop in price as demand declines.
Additionally, LINK’s Average Directional Index (ADX) recently recorded a significant increase, rising from 9.6 on March 31 to 30.2 on April 2, indicating a crucial shift in market sentiment and dynamics. ADX quantifies the strength of a trend, regardless of direction.
Sponsored
Typically, a reading below 20 suggests a weak or no-trend market, while a value above 25 indicates a strong trend. With Chainlink currently in a downtrend, an ADX of 30.2 suggests strong downward momentum.
Read more: 7 reasons to invest in Chainlink (LINK) in April 2024
Price prediction
The formation of a bearish crossover on the 4-hour chart on April 1 points to a possible downtrend for Chainlink. This type of crossover occurs when a short-term EMA falls below a long-term EMA, usually signaling a change from an uptrend to a downtrend in the market.
Sponsored
In LINK’s situation, the widening gap between the average lines after the crossover indicates growing bearish momentum. This gap, which reflects a stronger presence of sellers in the market, could cause prices to fall. If the $17.3 support level fails, Chainlink could fall to $16.2.
On the other hand, if an uptrend begins, the price could recover, breaking past resistance levels to reach $20.7 or even rise to the $22 zone.
Disclaimer
All information contained on our website is published in good faith and for general information purposes only. Any action the reader takes based on the information contained on our website is at their own risk.


 faces downward pressure)