
Pepe (PEPE) broke a long-term downtrend line and nearly reached a new all-time high price this week.
Although memecoin saw a slight drop on February 28, it still trades above a small horizontal support area.
PEPE breaks long-term resistance
The weekly chart shows that PEPE fell below a downtrend line shortly after renewing its record price in May 2023. The line caused three price drops (red icons).
After starting a new jump in February, the price finally broke this line this week, appreciating 116%.
PEPE reached a high of $0.00000368 before falling slightly. Despite the decline, it is still trading above the last horizontal resistance area on the weekly chart.
Sponsored
The weekly Relative Strength Index (RSI) supports the continuation of the uptrend. The indicator is rising and is above 50.
Read more: 5 cryptocurrencies to keep an eye on in March
Price prediction
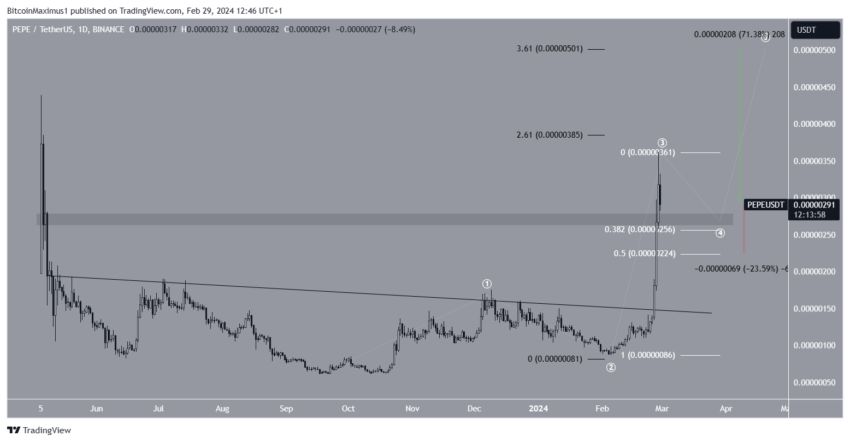
Technical analysis on the daily chart supports the continuation of the uptrend due to wave counting. The most likely suggests that PEPE is in wave three of a five-wave movement, having potentially initiated wave four. Wave three is almost 2.61 times the duration of wave one, a likely level for a local top.
Since the rejection, memecoin has returned to the $0.00000270 support area. If the count is correct, it will bounce off this support area and then begin a move that could culminate in a 70% jump to the next resistance at $0.0000050, which would be a new record price.
Sponsored
Despite this bullish forecast, closing below the $0.00000270 horizontal area means that wave four will retrace further. In that case, PEPE could fall 25% to the nearest support at $0.0000024.
Disclaimer
All information contained on our website is published in good faith and for general information purposes only. Any action the reader takes based on the information contained on our website is at their own risk.
Tags: PEPE capable reaching record price appreciating February


